
Last updated: 17 October 2026 · Compiled by IVA Advice Online from official and published sources
This page brings together official figures on personal debt in the UK: how much people owe, how many people enter an IVA, bankruptcy, debt relief order or trust deed each year since 2015, which firms set up the most IVAs and trust deeds, and how council tax arrears and bailiff use are changing. Every figure links to its source. Use the year slider to compare years.
How much debt is there in the UK?
People in the UK owed £1,984.3 billion at the end of July 2026, including mortgages. Of that, £257.5 billion was outstanding consumer credit — unsecured borrowing such as credit cards, personal loans, overdrafts and car finance.1 Borrowers paid an estimated £249 million a day in interest.1
| Measure (July 2026) | Figure |
|---|---|
| Average total debt per household, including mortgages | £68,318 |
| Average unsecured (consumer credit) debt per household | £8,867 |
| Average unsecured (consumer credit) debt per adult | £4,560 |
| Average credit card debt per household | £2,832 |
| Average credit card debt per adult | £1,456 |
| Average outstanding mortgage (10.62 million households with a mortgage) | £162,597 |
Source: The Money Charity, The Money Statistics, September 2026, based on Bank of England data.1 Averages are across all households or adults, including those with no debt.
Credit card and consumer borrowing
In August 2026, people borrowed a net £2.5 billion in consumer credit (up from £2.1 billion in July): £1.2 billion on credit cards and £1.3 billion through other forms such as personal loans and car finance. Consumer credit was growing at 9.6% a year and credit card borrowing at 13.3%. The average effective interest rate on interest-charging credit cards was 21.55%, and 9.96% on new personal loans.2
IVAs, bankruptcies, DROs and trust deeds by year
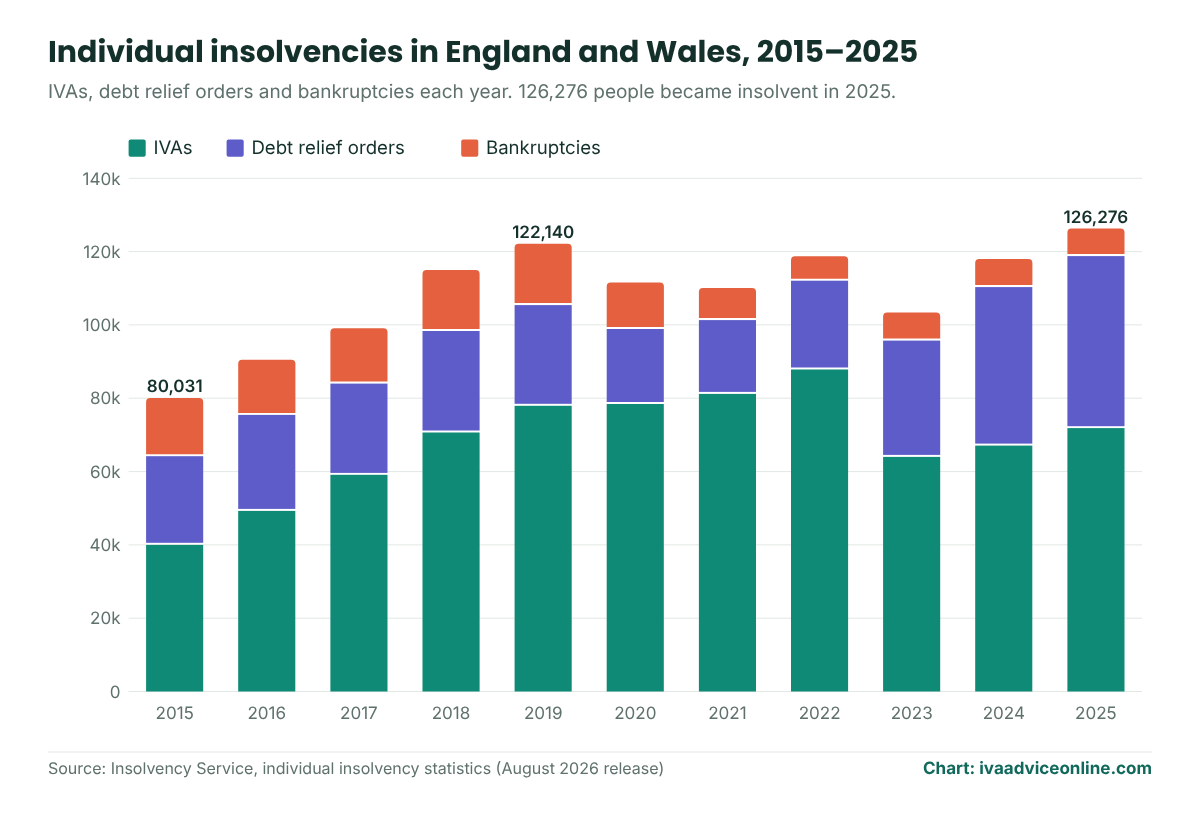
Move the slider to see the official figures for any year from 2015 to 2025. The chart shows how the mix of IVAs, debt relief orders and bankruptcies in England and Wales has changed; select a bar to jump to that year. To see IVA, DRO and bankruptcy rates for every council area, use our UK insolvency map.
Sources: Insolvency Service, individual insolvency statistics (August 2026 release, which revises earlier years)3; Ministry of Housing, Communities and Local Government council tax collection releases.6 Scotland and Northern Ireland figures are calendar years from the Insolvency Service's UK tables. Breathing Space is not an insolvency and is not included in the totals; the scheme started on 4 May 2021, so 2021 covers May to December only.
View all years as tables
| Year | Total | IVAs | DROs | Bankruptcies | Breathing Space |
|---|---|---|---|---|---|
| 2015 | 80,031 | 40,005 | 24,177 | 15,849 | – |
| 2016 | 90,501 | 49,255 | 26,196 | 15,050 | – |
| 2017 | 99,107 | 59,105 | 24,894 | 15,108 | – |
| 2018 | 114,994 | 70,667 | 27,684 | 16,643 | – |
| 2019 | 122,140 | 77,930 | 27,467 | 16,743 | – |
| 2020 | 111,558 | 78,427 | 20,473 | 12,658 | – |
| 2021 | 110,037 | 81,179 | 20,136 | 8,722 | 41,126 |
| 2022 | 118,745 | 87,841 | 24,221 | 6,683 | 70,787 |
| 2023 | 103,424 | 64,009 | 31,717 | 7,698 | 88,390 |
| 2024 | 117,955 | 67,084 | 43,249 | 7,622 | 89,020 |
| 2025 | 126,276 | 71,842 | 46,939 | 7,495 | 89,130 |
| Year | Scotland total | Protected trust deeds | Scottish bankruptcies | NI total | NI IVAs |
|---|---|---|---|---|---|
| 2015 | 8,785 | 4,308 | 4,477 | 2,690 | 1,147 |
| 2016 | 9,779 | 5,305 | 4,474 | 2,582 | 1,219 |
| 2017 | 10,585 | 5,894 | 4,691 | 2,878 | 1,537 |
| 2018 | 12,039 | 7,331 | 4,708 | 2,371 | 1,250 |
| 2019 | 13,612 | 8,765 | 4,847 | 2,710 | 1,570 |
| 2020 | 9,078 | 6,175 | 2,903 | 1,751 | 1,258 |
| 2021 | 7,549 | 5,235 | 2,314 | 1,796 | 1,478 |
| 2022 | 7,982 | 5,665 | 2,317 | 1,743 | 1,467 |
| 2023 | 8,112 | 5,628 | 2,484 | 1,538 | 1,183 |
| 2024 | 7,618 | 5,123 | 2,495 | 1,535 | 1,086 |
| 2025 | 7,288 | 4,449 | 2,839 | 1,599 | 1,158 |
| Date | Arrears |
|---|---|
| 31 March 2015 | £2,657.4m |
| 31 March 2016 | £2,734.2m |
| 31 March 2017 | £2,835.7m |
| 31 March 2018 | £3,023.2m |
| 31 March 2019 | £3,236.1m |
| 31 March 2020 | £3,576.7m |
| 31 March 2021 | £4,418.2m |
| 31 March 2022 | £4,965.7m |
| 31 March 2023 | £5,478.8m |
| 31 March 2024 | £5,982.4m |
| 31 March 2025 | £6,641.9m |
| 31 March 2026 | £7,423.9m |
What the figures show
- Individual insolvencies in England and Wales rose from 80,031 in 2015 to 126,276 in 2025, the highest annual total since 2010.3
- IVAs peaked at 87,841 in 2022, fell to 64,009 in 2023, and have risen again to 71,842 in 2025.3
- Debt relief orders almost doubled from 24,221 in 2022 to 46,939 in 2025.3
- Bankruptcies more than halved, from 15,849 in 2015 to 7,495 in 2025.3
- In Scotland, protected trust deeds peaked at 8,765 in 2019 and were 4,449 in 2025.3
- Council tax arrears in England have almost trebled, from £2.7 billion in 2015 to £7.4 billion in 2026.6
Latest month: August 2026
Monthly figures for England and Wales are seasonally adjusted.
- 11,644 people entered insolvency in England and Wales, 3% more than in August 2025: 7,039 IVAs (up 8%), 3,880 DROs (down 6%) and 725 bankruptcies (up 14%).4
- In the 12 months to August 2026, 1 in 360 adults (27.8 per 10,000) became insolvent, up from 1 in 408 a year earlier.4
- An average of 385 people a day were declared insolvent or bankrupt in England and Wales in the three months to August 2026.1
- There were 5,012 Breathing Space registrations (4,871 standard and 141 mental health), 32% fewer than in August 2025.4
- In Scotland, 2,181 people became insolvent between April and June 2026 (1,332 protected trust deeds and 849 bankruptcies). In Northern Ireland, 140 people became insolvent in August 2026.4
Largest IVA firms by number of new IVAs
The Insolvency Service publishes the number of new IVAs registered by each firm every year. The ten largest firms by new IVAs in England and Wales are shown below; choose a year to compare.
| # | Firm | New IVAs | Share |
|---|---|---|---|
| 1 | The Insolvency Group | 14,215 | 19.8% |
| 2 | My Debt Plan | 5,470 | 7.6% |
| 3 | PayPlan Partnership | 5,150 | 7.2% |
| 4 | Bennett Jones Insolvency | 4,260 | 5.9% |
| 5 | J3 Debt Solutions | 4,224 | 5.9% |
| 6 | Creditfix | 3,741 | 5.2% |
| 7 | UK Debt Expert Group | 3,710 | 5.2% |
| 8 | Anchorage Chambers | 3,696 | 5.1% |
| 9 | AFA Insolvency | 3,341 | 4.6% |
| 10 | Lawson Fox | 3,125 | 4.3% |
| All other firms | 20,923 | 29.1% |
Source: Insolvency Service, Individual Voluntary Arrangements outcomes and providers, Table 3, each year as first published.5 Firms are as recorded by the Insolvency Service when the data was extracted; IVAs that moved between firms are not always reflected, and later releases restate earlier years. Shares are calculated from published counts. Totals can differ slightly from the main insolvency statistics because of timing. The 2020 edition (source of the 2019 figures) named only firms in the 2020 top 90%, so some firms that were large in 2019 appear under "All other firms".
- In 2025 the six largest firms accounted for 52% of new IVAs, and the largest 18 firms for over 90%.5
- Creditfix was the largest IVA firm every year from 2019 to 2023; it registered no new IVAs from September to December 2025.5
For monthly figures by firm and market share over time, see our IVA company statistics.
Largest trust deed firms in Scotland
The Accountant in Bankruptcy (AiB) publishes the number of new protected trust deeds by trustee firm each quarter. Firm-level figures are available from April 2022. Years below are financial years (April to March).
| # | Firm | New trust deeds | Share |
|---|---|---|---|
| 1 | Harper McDermott | 1,374 | 29.6% |
| 2 | Uk Debt Expert | 1,263 | 27.2% |
| 3 | J3 Debt Solutions | 1,019 | 21.9% |
| 4 | Carrington Dean | 467 | 10.1% |
| 5 | Begbies Traynor | 189 | 4.1% |
| 6 | Payplan Scotland | 159 | 3.4% |
| 7 | Wbg (Wylie and Bisset) | 153 | 3.3% |
| 8 | The Insolvency Group | 8 | 0.2% |
| 9 | Assure Insolvency | 6 | 0.1% |
| 10 | Quantuma | 2 | 0.0% |
| All other firms | 4 | 0.1% |
Source: Accountant in Bankruptcy, Scottish Statutory Debt Solutions Statistics 2026-27 Quarter 1, quarterly protected trust deeds by trustee organisation, summed to financial years.7 Firm names are shown as AiB publishes them. 2025-26 and 2026-27 figures are provisional. In 2024-25 the firm figures add to 4,928 against AiB's published total of 4,920; shares use the published total.
Total protected trust deeds by financial year: 8,743 (2019-20), 5,263 (2020-21), 5,464 (2021-22), 5,644 (2022-23), 5,587 (2023-24), 4,920 (2024-25) and 4,644 (2025-26).8
Council tax arrears and bailiff statistics
Councils in England collected 95.6% of the council tax due for 2025-26, down 0.3 percentage points on the previous year: £43.0 billion collected of the £45.0 billion due.6
- Total council tax arrears in England reached £7.4 billion at 31 March 2026, up £782 million (11.8%) on a year earlier.6
- Councils wrote off £306 million of council tax in 2025-26.6
- Councils in England and Wales passed 1.72 million council tax cases to bailiffs (enforcement agents) in 2025/26, compared with 1.74 million in 2024/25.9
- 153 councils (48%) increased their use of bailiffs in 2025/26.9
If you're behind on council tax, see our guides on what to do if you can't pay council tax, stopping council tax bailiffs and your rights with bailiffs.
How many people are struggling with debt?
The Financial Conduct Authority's Financial Lives survey (fieldwork February to June 2024, published May 2025) found:10
- 4.5 million adults (8%) were in financial difficulty, meaning they had missed domestic bills or credit repayments in three or more of the previous six months.
- 7.3 million adults (13%) said keeping up with bills and credit commitments was a heavy burden.
- 13.1 million adults (24%) had low financial resilience.
- 10% of adults had no cash savings at all, and a further 21% had less than £1,000.
StepChange Debt Charity helped 163,916 new clients in 2025. Their average unsecured debt was £16,874 (£19,701 including arrears), average credit card debt was £8,021, 33% were behind on council tax (average arrears £2,137), 37% were behind on energy bills, 18% on rent, and 28% had a negative budget.11 These figures describe people who sought debt advice, not the whole population.
Using these statistics
You're welcome to use the figures on this page. Please credit the original source shown for each figure, and link to this page if it helped you find them:
Source: IVA Advice Online, "UK Debt Statistics 2026", https://ivaadviceonline.com/uk-debt-statistics/
Download the insolvencies by year data (CSV) – IVAs, DROs, bankruptcies and trust deeds for England and Wales, Scotland and Northern Ireland, 2015–2025, plus council tax arrears in England. Contains public sector information licensed under the Open Government Licence v3.0.
Sources
- The Money Charity, The Money Statistics, September 2026. Figures as at end of July 2026, based on Bank of England data; insolvency-per-day figure for the three months to August 2026.
- Bank of England, Money and Credit – August 2026, published 29 September 2026.
- Insolvency Service, Individual insolvency statistics: August 2026 data tables 1a (seasonally adjusted monthly figures), 1b, 6, 8 and 9, published 18 September 2026 (annual figures 2016–2025, latest revisions). 2015 figures: England and Wales from the same release's long-run series; Scotland from the December 2025 release; Northern Ireland 2015–2018 from the October to December 2023 release long-run series.
- Insolvency Service, Commentary – Individual insolvency statistics: August 2026, published 18 September 2026.
- Insolvency Service, Individual Voluntary Arrangements outcomes and providers 2025, Table 3 and commentary, published 27 February 2026; earlier years from the 2020–2024 editions of the same release (2019 figures from the 2020 edition).
- Ministry of Housing, Communities and Local Government, Collection rates for council tax and non-domestic rates in England, 2025 to 2026, published 24 June 2026, revised 31 July 2026; arrears for earlier years from Table 7 of the 2018-19 to 2023-24 editions.
- Accountant in Bankruptcy, Scottish Statutory Debt Solutions Statistics 2026-27 Quarter 1 (Excel tables), published 22 July 2026.
- Accountant in Bankruptcy, Scottish Statutory Debt Solutions – Annual Statistics: 2025-26, published 26 August 2026 (official statistics in development).
- Money Advice Trust / National Debtline, "Almost half of councils increase bailiff use as council tax arrears hit £7.4bn", published 27 August 2026 (Freedom of Information research).
- Financial Conduct Authority, Financial Lives 2024: key findings, published 16 May 2025.
- StepChange Debt Charity, Statistics Yearbook 2025.
This page provides general information, not advice about your circumstances.